Food and protein
What to Eat on Ozempic Shot Day
What to eat on Ozempic shot day: small, lower-fat meals, with USDA protein and fat per 100 g and each label's own nausea rates for context.
Guides
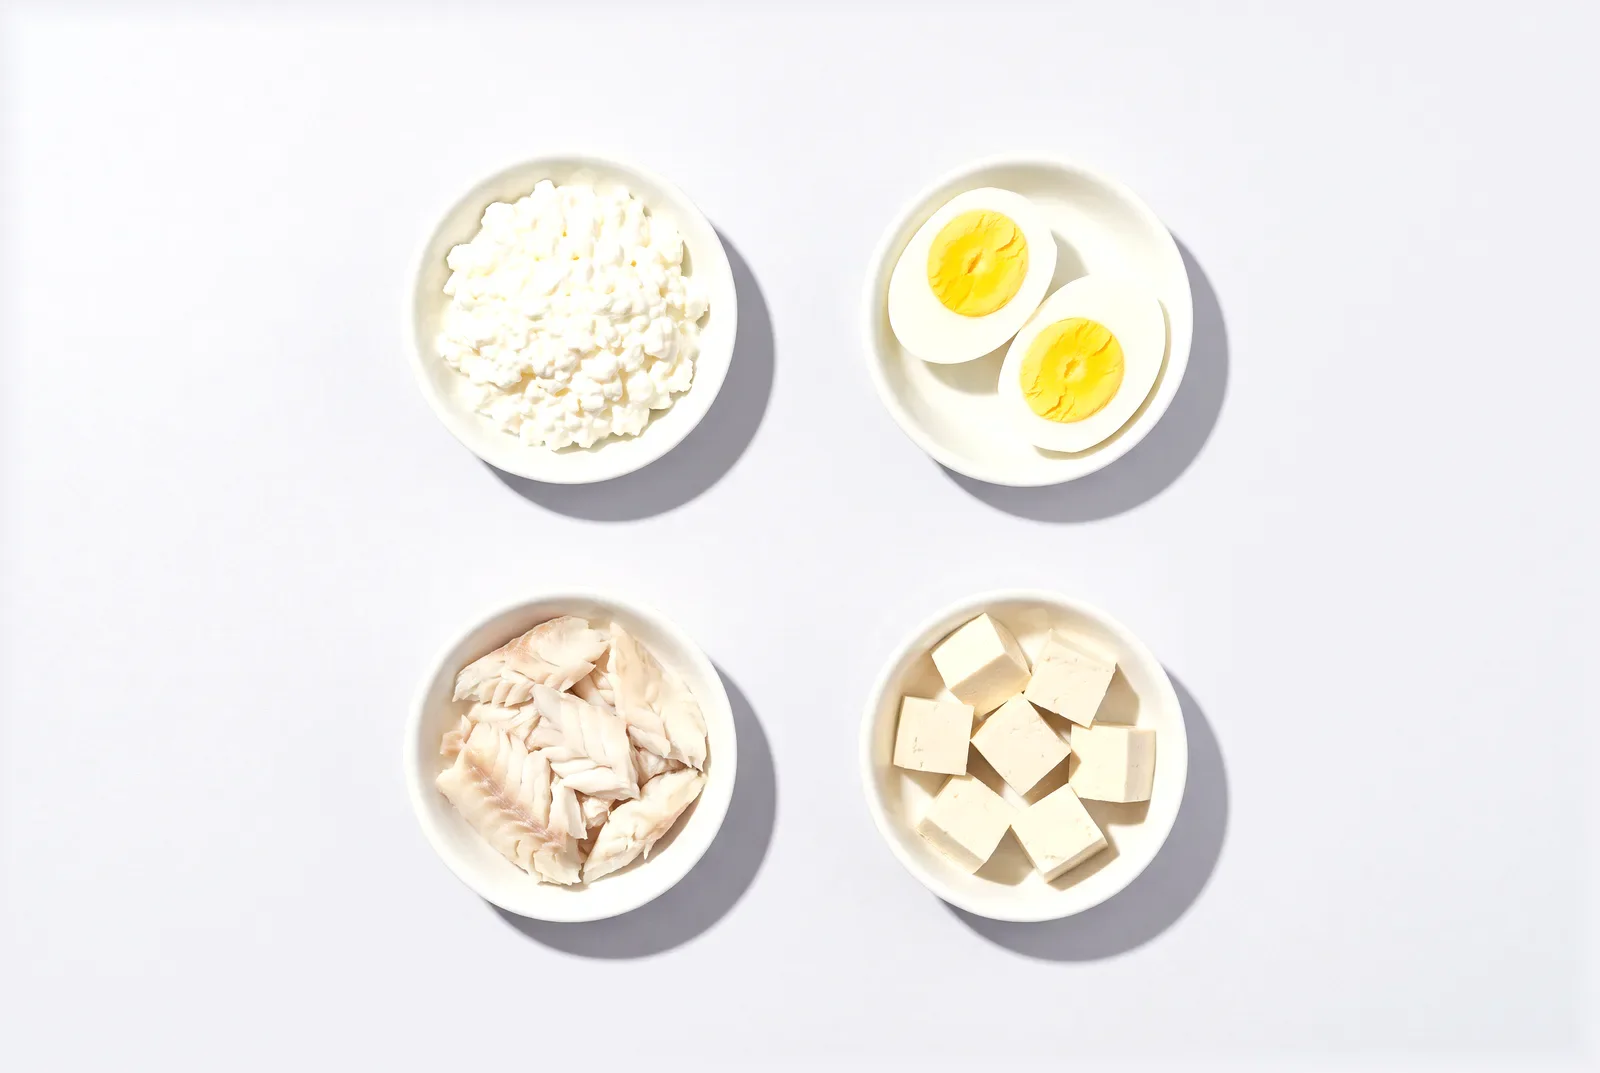
The GLP-1 foods with the most protein per 100 g in USDA FoodData Central are roasted chicken breast and roasted turkey breast, at 31 g and 30.1 g. Grated parmesan follows at 28.4 g, ahead of lean beef, pork loin, salmon and shrimp. Which foods on a GLP-1 suit you best depends on texture, appetite and your dietitian's advice, so this list ranks one measure only.
The surprise is where the soft foods sit. Low-fat cottage cheese (12.4 g) and plain nonfat Greek yogurt (10.2 g) rank mid-table by weight, yet they are low in calories and need no chewing. The list below ranks 28 foods, so it shows which small portions carry the most protein. It is a reference, not a target and not a verdict on any food.
In short
- USDA FoodData Central lists roasted chicken breast at 31 g of protein per 100 g, the highest of the 28 foods.
- Low-fat cottage cheese has 12.4 g of protein for 72 kcal per 100 g, according to USDA FoodData Central.
- USDA FoodData Central lists cooked oats at 2.5 g per 100 g, about a fifth of cottage cheese.
The 28 foods below are ranked by grams of protein per 100 g of the food in the state its record describes, every figure from USDA FoodData Central, with roasted chicken breast first at 31 g. Kilocalories are per 100 g too, and each food links to its own record.
| Rank | Food | Protein (g per 100 g) | Energy (kcal per 100 g) |
|---|---|---|---|
| 1 | Chicken breast, roasted | 31 | 165 |
| 2 | Turkey breast, roasted | 30.1 | 147 |
| 3 | Parmesan cheese, grated | 28.4 | 420 |
| 4 | Beef, ground, 90% lean, cooked | 26.6 | 214 |
| 5 | Pork loin, roasted | 26.2 | 143 |
| 6 | Salmon, cooked | 25.7 | 231 |
| 7 | Shrimp, cooked | 24 | 99 |
| 8 | Mozzarella cheese, part skim | 23.7 | 298 |
| 9 | Cheddar cheese | 22.9 | 403 |
| 10 | Peanut butter, smooth | 21.9 | 588 |
| 11 | Almonds, dry roasted | 21 | 598 |
| 12 | Cod, cooked | 20.4 | 84 |
| 13 | Tempeh | 20.3 | 192 |
| 14 | Tuna, light, canned in water, drained | 19.4 | 86 |
| 15 | Tofu, firm | 17.3 | 144 |
| 16 | Egg, whole, hard-boiled | 12.6 | 155 |
| 17 | Cottage cheese, lowfat | 12.4 | 72 |
| 18 | Edamame, cooked | 11.9 | 121 |
| 19 | Egg white, raw | 10.9 | 52 |
| 20 | Greek yogurt, plain, nonfat | 10.2 | 59 |
| 21 | Lentils, boiled | 9 | 114 |
| 22 | Chickpeas, boiled | 8.9 | 164 |
| 23 | Black beans, boiled | 8.9 | 132 |
| 24 | Hummus | 7.8 | 237 |
| 25 | Yogurt, plain, skim milk | 5.7 | 56 |
| 26 | Quinoa, cooked | 4.4 | 120 |
| 27 | Milk, reduced fat, fluid | 3.3 | 50 |
| 28 | Oats, cooked | 2.5 | 71 |
No, a ranking by protein per 100 g does not show the best foods on a GLP-1, only which foods carry the most protein in USDA FoodData Central records. The list ranks 28 foods using one record for each food. Where a record describes a cooked food, such as roasted chicken or boiled lentils, the figure is for the cooked food. Egg white and firm tofu are the exceptions, because their records describe the raw food.
Ranking by weight answers a different question from ranking by protein per 100 kcal, which the section below works through. The list leaves out serving sizes, shakes and supplements, branded products, local foods that differ by market, and any daily protein target.
The nine foods above 22 g of protein per 100 g in USDA FoodData Central are all animal foods: roasted poultry, lean meat, fish, shrimp and hard cheese. Less water explains part of the pattern.
USDA FoodData Central lists 22.6 g of water per 100 g for grated parmesan and 36.8 g for cheddar, against 82.5 g for low-fat cottage cheese. With less water in the weight, more of each 100 g is protein, fat and carbohydrate.
The first plant foods are peanut butter (21.9 g) and almonds (21 g), but they carry 588 and 598 kcal per 100 g. Tempeh (20.3 g, 192 kcal) and firm tofu (17.3 g, 144 kcal) pack similar protein into fewer calories. Beans and lentils sit between 8.9 g and 9 g. This is a density pattern, not a quality verdict.
Ranking by protein per 100 kcal reorders the list, because USDA FoodData Central lists parmesan at 420 kcal per 100 g and cod at only 84 kcal. The sums below divide each food's protein by its kilocalories, then multiply by 100.
Parmesan ranks third by weight but far lower per calorie. Cottage cheese and Greek yogurt rise. Which measure matters depends on whether the limit on your plate is weight or calories.
USDA FoodData Central values show that soft foods such as hard-boiled egg (12.6 g), low-fat cottage cheese (12.4 g) and nonfat Greek yogurt (10.2 g) give protein per 100 g without much chewing. Cooked flaking fish and firm tofu list higher figures.
Cod gives 20.4 g for 84 kcal per 100 g, canned light tuna in water gives 19.4 g for 86 kcal, and firm tofu gives 17.3 g for 144 kcal. Boiled lentils, at 9 g, suit a spoon and a softer texture.
Raw egg white lists 10.9 g for just 52 kcal, while hard-boiled whole egg lists 12.6 g for 155 kcal. The softest, wettest foods here rank below the meats on protein per 100 g. Roasted chicken or turkey, shredded fine, keeps the high protein of the top ranks in a softer form.
A small portion can still deliver protein when the food is protein-dense, as the worked example below shows. The Wegovy prescribing information on DailyMed states that Wegovy delays gastric emptying. The same label frames Wegovy as an adjunct to a reduced-calorie diet and physical activity for chronic weight management. Other medicines have their own labels, and your prescriber decides what suits you.
If you cannot keep food or fluids down, or a lost appetite worries you, contact your prescriber or doctor, and seek emergency care for severe symptoms. Readers wondering when appetite might shift can see a worked week-by-week table of how semaglutide decays.
The 20 g protein gap below is an illustrative figure, not a target. The grams of food needed are 20 ÷ protein per 100 g × 100, using the table values.
| Food | Grams of food for a 20 g gap |
|---|---|
| Chicken breast, roasted (31 g) | 64.5 |
| Cottage cheese, lowfat (12.4 g) | 161 |
| Greek yogurt, plain, nonfat (10.2 g) | 196 |
| Milk, reduced fat (3.3 g) | 606 |
| Oats, cooked (2.5 g) | 800 |
At the same weight, the top-ranked food closes the gap in under a tenth of the oats' bulk.
Use the table by dividing the protein you want from a food by its value and multiplying by 100, as in the example above. That turns per 100 g into grams on the plate. Choose the row whose texture and size you can finish.
In the Dose & Lose app you can log meals against protein, fiber and water goals by photo, barcode, label, search, voice or manual entry. Photo estimates are approximate, and the app does not weigh food.
To see how a medication level may change over time, the free GLP-1 half-life calculator estimates the amount left from your own doses. It never suggests a dose.
Some people choose to start with the protein food, so that it is eaten before they feel full. Your prescriber or dietitian can say whether that suits you. The table helps you pick which protein food to have, and nothing here says the order is required.
A shake is a way to take in protein without solid food, but this list covers whole foods only, so it cannot rank shakes. Check the product's own label against the per 100 g values here, and ask your dietitian which suits you.
Yes, cooking changes a food's water content, so protein per 100 g shifts with it. That is why this list uses the state each record describes, such as roasted chicken and boiled lentils, and why comparing a raw record with a cooked one can mislead.
No food on this list is shown to prevent muscle loss; the list shows only which foods carry the most protein per 100 g. The Wegovy label frames the medicine as an adjunct to a reduced-calorie diet and physical activity, so ask your prescriber about diet and activity.
Your prescriber or dietitian sets that number for you, and this article publishes no personal target. Needs differ between people, so a figure that suits one person may not suit another. The Dose & Lose app can track your daily protein against a goal you set.
USDA FoodData Central is the source of every value in the table. Each food in the table links to its own record, and the database is at fdc.nal.usda.gov.
Published by Petros IT Solutions SRL under the byline Dose & Lose Editorial Team. Send corrections to office@doseandlose.com.